Total Australian Credit

$9,854,070,456,040

More Information

AUD


Total Australian Credit outstanding includes all debt and equity outstanding of the domestic non-financial sectors.

Total Australian Credit has grown from AU$787.7 billion in December 1989 to AU$6.3 trillion in December 2016; an increase of a little over 800% over a 27 year period.


0,000 Thousands
0,000,000 Millions
0,000,000,000 Billions
0,000,000,000,000 Trillions

Menu

Who is paying the additional interest on the debt?


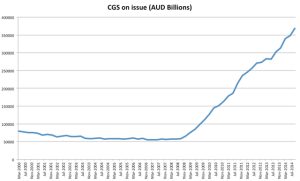
Much has changed in the world since the Financial Crisis of September 2008. Structural changes to financial markets have been a necessary evolution from this broadly unforeseen event. One of the major structural changes here in Australia has been the issuance of Commonwealth Government Securities (CGS) that has grown over 6 fold since September 2008; Australian Financial Intermediaries(AFIs) being are the largest domestic buyers of these instruments. The main reason for this is to ensure that in the event of a future financial crisis here in Australia the RBA would be able to inject liquidity into to AFIs quickly by printing currency and buying these holdings of bonds from the AFIs in a process known as Quantitative Easing (QE). This precautionary measure places the Australian banking system in much better position to weather a financial storm, but does come at a price. Chart 3.1 shows the change in the holdings of CGS and local and semi-government and other public authority securities by AFIs since January 2000.

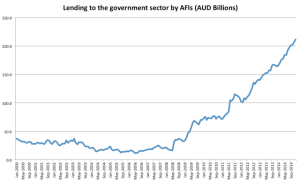
Chart 3.1
Chart3.1
The Australian Office of Financial Management (AOFM) is the body responsible for managing the market for issuing CGS. They regularly update the value of CGS on issue on their website www.aofm.gov.au. Graph 3.2 shows the growth in CGS on issue since January 2000.
Chart 3.2
Chart3.2
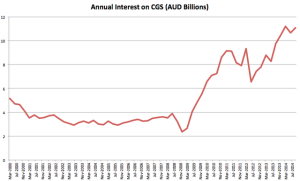
As at January 2000 when the Cash Rate was 5% interest on CGS was an average of 6.88% pa (across the 2yr, 3yr, 5yr and 10yr terms), which on an account of AU$79.78 billion was AU$5.49 billion pa. As at September when the Cash Rate was 2.5% interest on CGS was an average of 3.01% pa (across the 2yr, 3yr, 5yr and 10yr terms), which on an account of AU$368.47 billion was AU$11.10 billion. Chart 3.3 shows the quarterly change in annual interest on CGS since March 2000.
Chart 3.3
Chart3.3
The question is – who is paying the additional interest on the debt? And, who should be responsible to pay it?

One Response

  1. Good afternoon. Many thanks 🙂 Excellent article.

Leave a Reply

Your email address will not be published. Required fields are marked *