Interest rates in 2015
Happy New Year everyone!
We thought it would be a great idea to kick off 2015 with a blog to help provide more information around what is happening in the Australian economy. 2014 was an economically challenging year on many fronts; the Federal Government’s efforts to balance the budget have put negative pressure on national spending, the consistent downward trend of commodity prices since February-March 2014 has downsized the flow of funds from the mining boom, unemployment has steadily crept up to 6.3%, and business and consumer confidence are both declined to lows in the final reports of the year.
It is for this reason that many senior banking economists have revised their outlook for future changes to Cash Rate by Reserve Bank of Australia (RBA). NAB, Westpac and Deutsche Bank all foresee a 0.5 percentage point cut for 2015, with a 0.25 percentage point cut in first few months of the year. This prediction is in line with the trending market yields on Commonwealth Government Securities (CGS), which are bonds issued by the Federal Government.
Chart 1.1 shows this relationship in a graph.
Chart 1.1
[n/a]
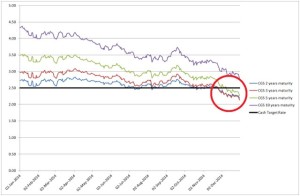
The market for CGS is seen to historically lead the Cash Rate, as these yields are a reflection of the market price for the future value of money. The Cash Rate is the interest rate that the RBA sets in the market for overnight funds between the banks. When the RBA reduces the Cash Rate they increase the supply of cash (currency), which in turn dilute the value of money into the future.Chart 1.2 shows a close up of the resent downward trend of CGS.
Chart 1.2
Note the trend of 2 year and 3 year CGS circled in red; 3 year CGS have in recent weeks trended lower than 2 year CGS. What this indicates is that investors (albeit fund managers who represent their investors) expect interest rates to be lower for longer so they see more value in holding 3 year bonds over 2 year bonds. In other words, investors are not confident that the Australian economy will improve enough to warrant the RBA to raise the Cash Rate any time soon.
Ultimately, if the market for CGS continues to decline it is likely that we will see interest rate cuts into 2015.

